Mobile App Download and Usage Statistics in 2025 for Marketers
The mobile app markets and stores are experiencing a surge of online traffic and downloads in recent times. As more and more people avidly use mobile phones for their daily life tasks and communication. The growth of the mobile app market is inevitable and the app market is surely going to have unprecedented growth in the foreseeable future.
You see, the mobile app market, although crowded, still has the potential for taking your business to new heights. Hence it is crucial to know the growing trends in the mobile app market and mobile app usage statistics worldwide for marketers and business owners.
If you are a business owner who wants to explore the digital realm of app stores and wants to launch a mobile app for user engagement and satisfaction and increase the exposure and scalability of your brand but is skeptical and hesitant to take the first step toward the digital transformation of your business.
Don’t worry we have researched and enlisted the mobile app download and mobile app usage statistics in 2024. That will not only give you the confidence to take that step in toward a digital revolution but also help you in making the right decision for your business.
Overview of Mobile App Downloads:
The mobile app industry is thriving and it comes as no surprise with a staggering 6.3 billion smartphone users and increasing mobile phone usage statistics worldwide. The steady growth rate of mobile app downloads and smartphone statistics indicates that this trend will continue without any signs of slowing down. Taking into account the 1.14 billion global tablet users, a figure that has seen an increase of roughly 36% in the past six years. Mobile apps are expected to generate over $935 billion in revenue in 2024.
Without downloads, apps cannot attain success. It may seem uncomplicated, yet many app owners tend to ignore this crucial aspect. Despite having the most exceptional application in existence, without downloads or users, your profits will be nonexistent. To ensure successful downloads of your app, it is crucial to conduct thorough research beforehand. We have compiled the most pertinent app download statistics regarding mobile app downloads and usage in 2024.
Global Downloads:
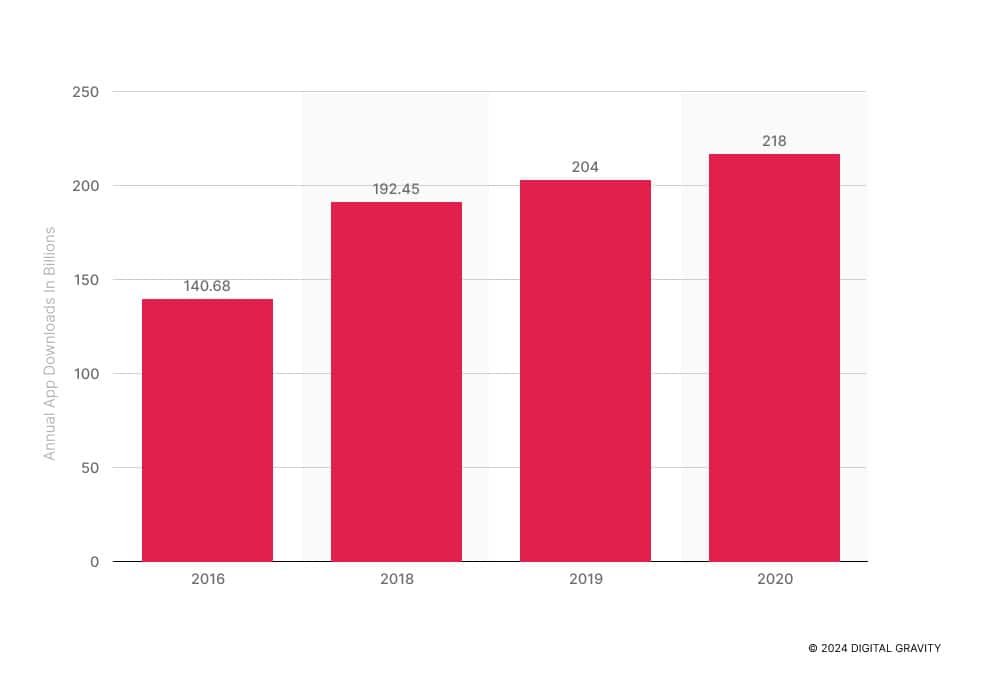
Due to the increasing popularity of mobile app usage, there has been a rise in the number of online app downloads worldwide. Approximately 218 billion app downloads occurred last year according to the app stats, representing a rise of around 7% from the preceding year. There has been a significant increase of 55% from 2016 to 2020. Although the year-over-year mobile app growth rate is not as steep, it remains trending upward.
Free vs. Paid Downloads
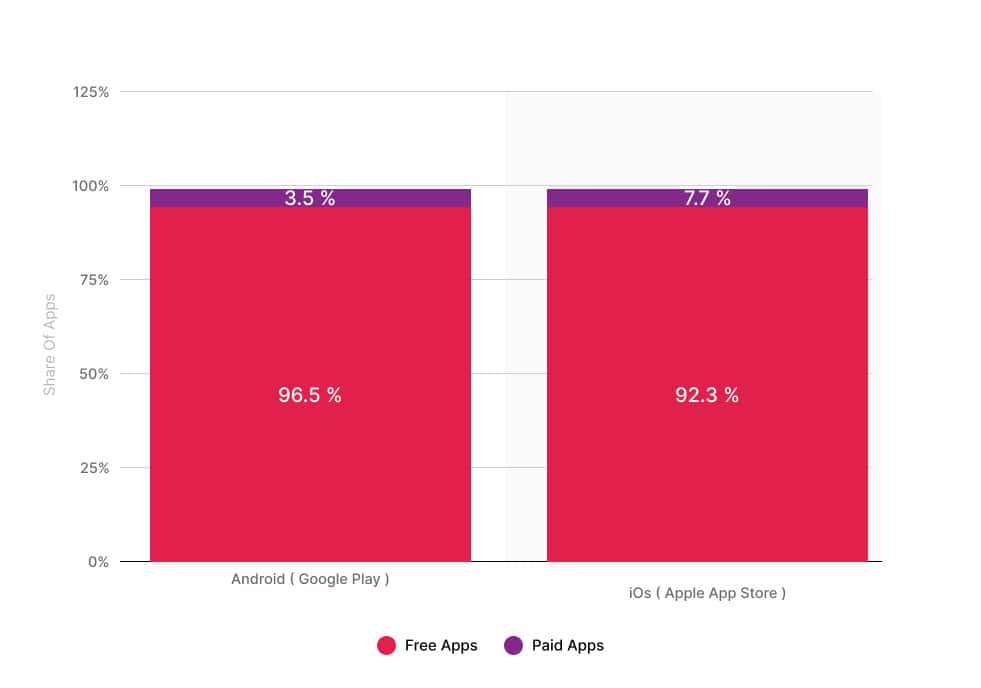
Examining the number of app downloads that are free versus paid, it becomes evident that a large proportion of global downloads are free and the overwhelming majority, a staggering 98%, of mobile app revenue generated globally is sourced from free apps. Merely a small segment of individuals express willingness to pay for downloads.
The overwhelming percentage of free applications found on Apple’s App Store and Google Play Store, accumulating approximately 92.3% to 96.5%. Conversely, paid application market shares are modest with only around 7.7% to 3.5%.
Let us clarify, We are not insinuating that launching a paid app should be entirely disregarded. The strategy to pursue the situation can depend on the type of app you have as both approaches come with unique advantages.
Platform-Specific Insights Google Play vs. App Store Downloads:
Most Mobile users tend to download apps from iOS and Android app stores to find popular apps. Let’s compare how the Apple App Store and Google Play Store stack up against each other regarding the availability of the most popular mobile apps and the number of downloaded apps on a global scale.
Globally, the Google Play Store is experiencing a rise in downloads. However, it’s worth noting that both stores observed a rise in download percentages between 2019 and 2020. The mobile app growth rate of the Google Play Store downloads was 31%, whereas that of the Apple App Store stood at a mere 2.5%. Thus, the Google Play Store has a larger number of downloads and is experiencing faster growth and these trends will remain consistent this year in 2024.
Apple App Store Download Statistics:
It is necessary to delve deeper into the statistics and figures and analyze each platform separately to understand the digital realm of mobile apps:
Most Popular App Store Categories
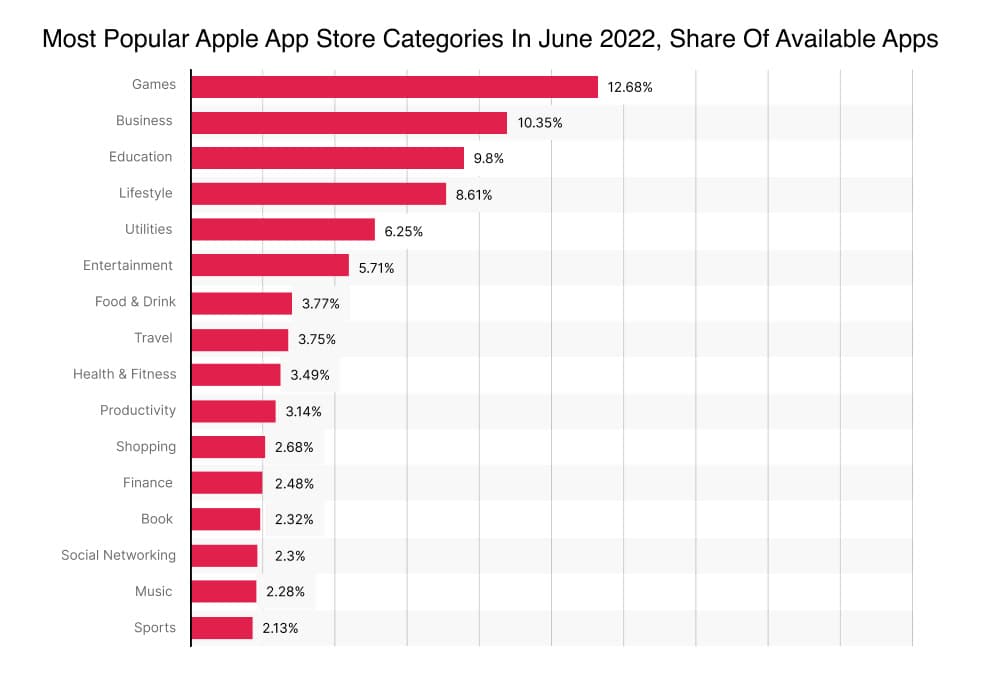
Beginning with the app download statistics of the Apple App Store. the most popular categories for top used apps in the Apple App Store as of Q3 2022 are:
- The most sought-after category of apps on the iOS platform is gaming, comprising 12.68%.
Secondly, business apps accounted for 10.35%. - Finally, education apps held the third position with a share exceeding 9.8%.
- Gaming apps consistently rank high in both availability and mobile app downloads, with many being the top most used, downloaded, and highest-grossing mobile apps globally.
Apple App Store Availability:
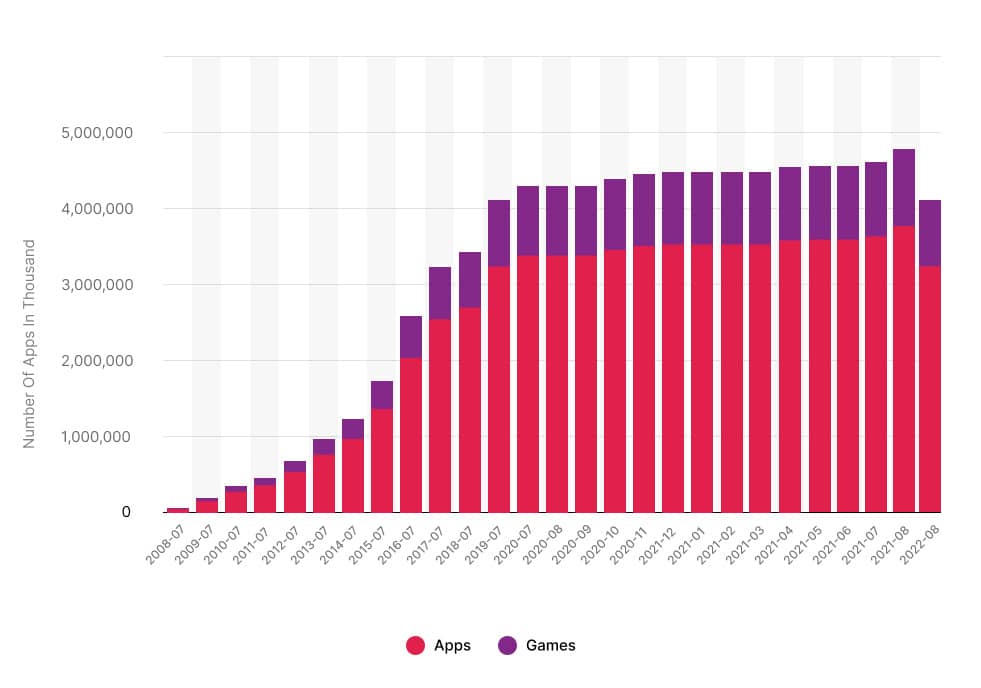
To learn the availability of mobile apps on the Apple app store. Let’s see the progression of the Apple App Store throughout its existence over the years:
- On July 10, 2008, the Apple App Store was made accessible through an update to iTunes.
- At the start, there were roughly 500 downloadable applications accessible on the app store.
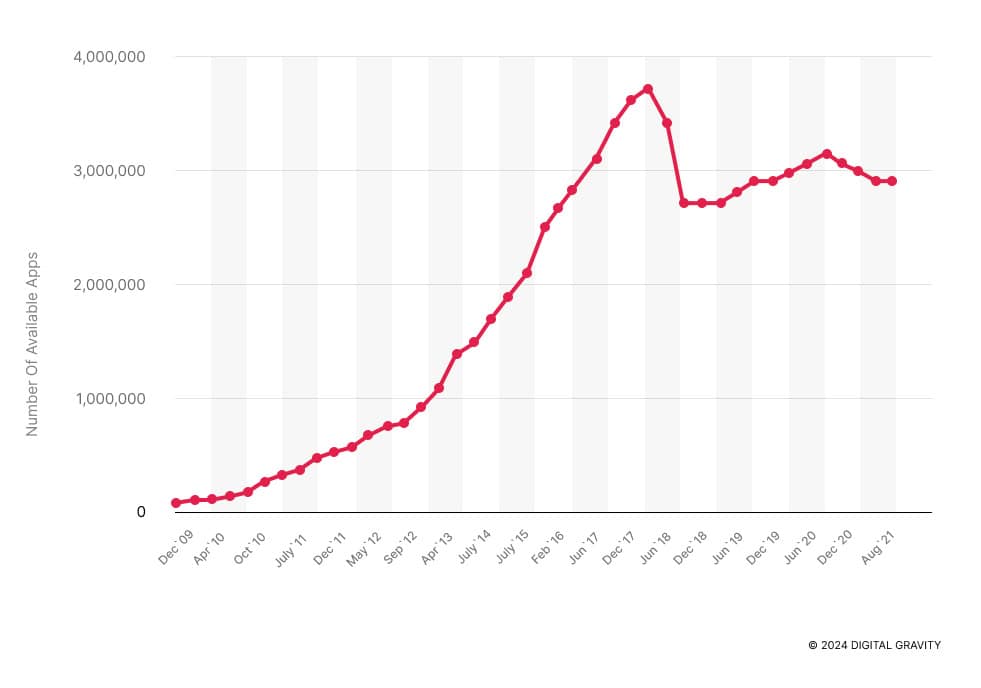
- The year 2012 saw the total number of apps available on both the Apple App Store and Google Play Store surpassing one million.
- By 2017, there were roughly 220 billion mobile app downloads recorded.
- Apple app developers made an astonishing $20 billion in 2016.
- Over time, the App Store experienced growth and now has an extensive collection of millions of mobile apps.
- In 2017, with approximately 2.2 million apps the app store reached its highest number of available mobile apps.
- The numbers showed a slight decrease in the subsequent years when Apple initiated the deletion of old or 32-bit apps.
- In 2021, there were over 1.8 million apps available in the App Store.
- By July of 2023, the App Store had exceeded one million gaming apps while offering a lesser amount of non-gaming options with approximately 3.83 million mobile apps. Interestingly, between Q2 and Q3 of 2022, there was nearly a quarter decline (25%) witnessed in mobile applications available inside Apple’s App Store.
Google Play Store Download Statistics:
The Android Market has undergone a significant transformation to become what we now know as the Google Play Store. Let’s learn about the number of apps available on Google Play:
Google Play Store Availability:
From its early days to the present, let’s briefly examine the history of the Google Play Store:
- Before becoming Google Play Store (2008-2012), the Android Market emerged in 2008 for users to obtain apps and games compatible with the nascent Android operating system.
- In March 2012, the Play Store itself featured up to 450,000 options consisting mainly of Android-compatible applications/games available for immediate download on this innovative store concept.
- From 2012 to 2015, over 1 million apps were available on the store.
- Since 2015, Google Play has sustained its mobile app growth trajectory. The platform’s offerings multiplied to hit an all-time high of 3.6 million apps accessible to Android patrons in 2017.
- Currently, over 3.7 million mobile apps are available on Google Play Store today.
Most Popular Google Play Store App Categories:
The Google Play Store shows the following app categories as most popular for the second quarter of 2022:
- Approximately 13.8 percent of all available mobile apps are gaming apps offering users a range of games to download and enjoy.
- Ranking second, education apps hold a 10.47 percent share and include educational content, learning tools, and resources.
- The Google Play Store currently offers 21,727 tool apps with over 50,000 downloads per app.
- Mobile users frequently utilize entertainment apps, such as streaming services, video players, and music applications.
- On the Play Store, business apps also enjoy a significant presence comprising productivity tools, communication applications, and office suites related to businesses.
- Mobile and audio apps enable users to stream music, listen to podcasts, and consume audio content and are also a popular category on the Play Store.
- Finally, in the realm of e-commerce, shopping apps are crucial as they provide users with a platform to effortlessly peruse and buy products online making them popular.
Mobile App Usage Statistics
For several years, the use of mobile applications has shown an increase in mobile app industry trends with further growth anticipated.
Following are some significant mobile app usage statistics Android and iOS:
- Despite a 2% decrease in worldwide consumer spending, downloads and time spent on these apps increased by 11% and 9%, respectively.
- Around 35% of millennials view Amazon as the most important mobile application, with Gmail and Facebook trailing closely behind at 30% and 29%, respectively.
- 18 out of 100 apps downloaded by mobile app users globally were used only once following installation.
- Only 65.7% of smartphone users in the United States had a gaming app installed on their device as of July 2018.
- WeChat (19.5%), TikTok (17%), and YouTube (12.7%) make up half of the total time spent online at 50%.
- 3 out of 5 smartphone users choose not to download an app to finish a transaction.
- Insufficient storage space causes a quarter of smartphone users to uninstall apps.
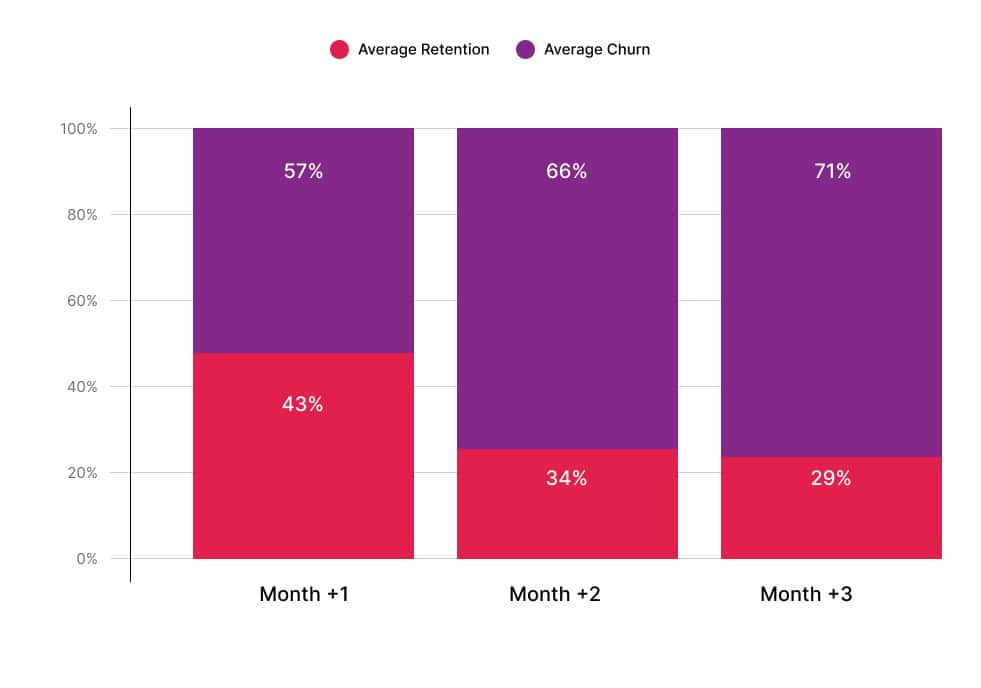
- 71% of app users leave the app after three months.
- In 2022, the number of new mobile app downloads is expected to reach an astonishing 255 billion. The previous year witnessed a staggering rate of mobile app downloads with as much as 485,000 downloads every minute.
- Out of their working hours, users devote one-third or 5 hours daily to mobile activities.
- In 2022, games experienced the largest setback due to an increase in demand for essential services. Despite economic challenges, non-gaming applications have achieved impressive growth.
- By the year 2022, over $10 million in annual revenue was generated by a whopping 1,419 apps and games. Notably, around 224 applications surpassed an outstanding milestone of yearly earnings that extend to more than $100 million. Furthermore, among them were ten elite gaming apps that hit incredible heights beyond the $1 billion mark for their annual revenues.
- Video content, user-generated content, and mindfulness applications receive a significant commitment from Gen Z.
- Amazon garnered more active users on Black Friday than Walmart and Target combined.
- By 2022, the worldwide duration of social app usage surpassed a staggering two trillion hours.
- Finally, roughly 56.9% of Americans have developed an addiction to their mobile devices.
The above-mentioned mobile usage analytics and app download statistics show promising mobile app growth that marketers can achieve hefty benefits from introducing a mobile app on the online market.
Generating Revenue through Mobile Apps:
Monetizing a mobile app involves generating profit from user interactions.
Mobile App Retention:
You must be aware that a mobile app download doesn’t always result in mobile app usage. Within the initial 90 days of downloading an app, a significant percentage (71%) of users stop using it. So, how does this affect you and your application?
Hence, you must monitor the retention and churn rate to incentivize users to continuously use your app and brainstorm methods to acquire new downloads.
Key Mobile Apps for Daily Use:
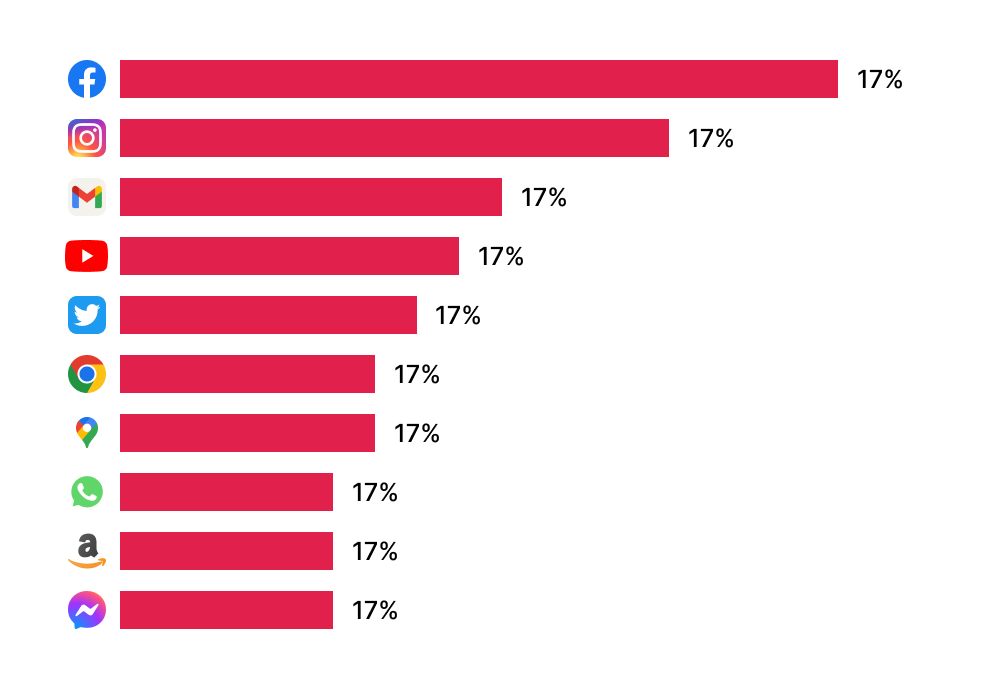
Mobile App downloads do not indicate mobile app usage but there are also some apps that smartphone users cannot live without. Upon reviewing this list, it becomes apparent that the most downloaded apps 2023 serve varying functions and have practicality in daily use:
- Social media apps like Facebook, Instagram and Tiktok are the most popular mobile apps.
- Gmail is frequently used for sending important emails.
- YouTube is used for consuming video content.
- Google Maps are used for navigation.
- Users make Online purchases through Amazon.
- WhatsApp and Messenger are used for instant free messaging.
- Google Chrome is the most avidly used browser.
Spending on Mobile Apps in iOS and Android Markets
Here’s the breakdown of app revenues in Q3 of 2022:
- The worldwide gross app revenue on Google Play Store stood at approximately 10.4 billion U.S. dollars, indicating a decline from the previous quarter’s figures.
- Consumer spending on in-app purchases, subscriptions, and premium applications reached a total of $21.2 billion through Apple’s App Store reflecting a decrease of approximately 3% from the previous quarter.
- The year 2021 witnessed a remarkable surge in global consumer expenditure on mobile applications through iOS, Google Play, and third-party Android app stores to an astonishing $170 billion. This reflected a rise of 19 percent from the preceding year’s spending. Significantly enough, people downloaded as many as 230 billion apps this year which is another noteworthy milestone.
- The global app spending for 2025 is estimated at an astonishing $270 billion, exceeding more than 2.5 times mobile app spending in 2020. Due to COVID-19, there was a significant surge in in-app purchases which resulted in year-over-year growth of up to 30 percent during the 2019-20 fiscal year.
- By 2027, user spending on mobile apps from the Apple App Store alone is predicted to reach $125 billion in the long term. Moreover, when coupled with Google Play store expenditures, total consumer outlay will nearly touch $186 billion by that time frame.
- The role of mobile apps in our digital existence remains critical, and their influence on worldwide expenditures is quite significant!
- Mobile App Engagement Across Age Groups:
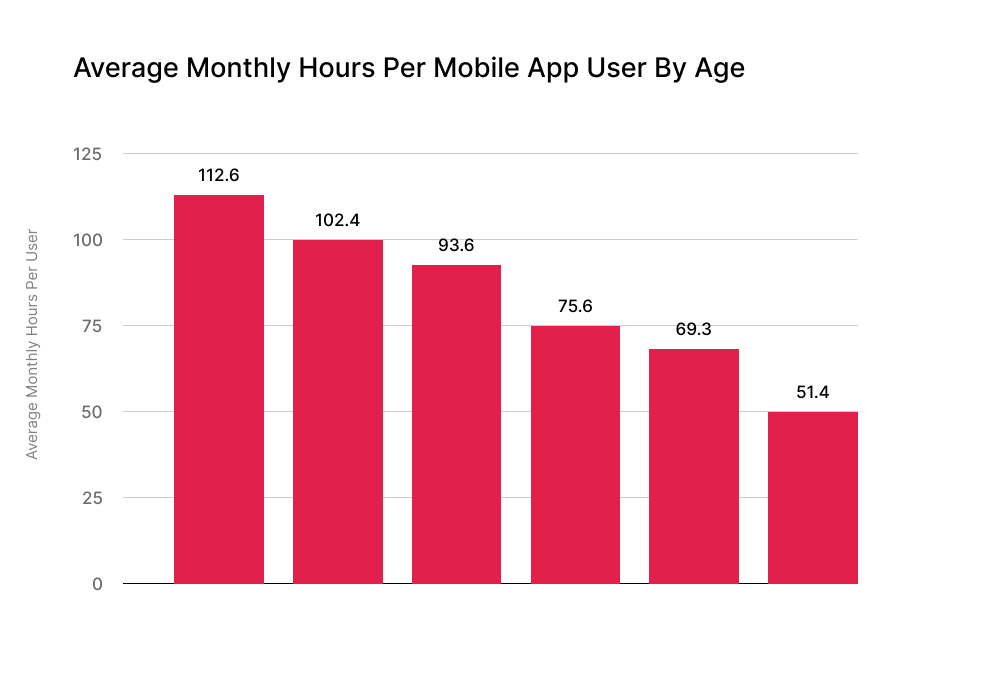
If you assume that younger generations devote more time to using mobile apps than their older counterparts, your assumption is likely accurate. Individuals aged 45-54 allocate approximately 1 hour and 15 minutes daily for mobile app usage, which falls short only by 27 minutes compared to those in the 25-34 age brackets. Mobile apps that are used by individuals over the age of 65 use apps for 1 hour a day.
Mobile App Usage by Device:
Mobile usage is not of the same kind for all users. Depending on the type of mobile device people use there is a difference in their usage patterns.
Smartphone App Usage and Insights:
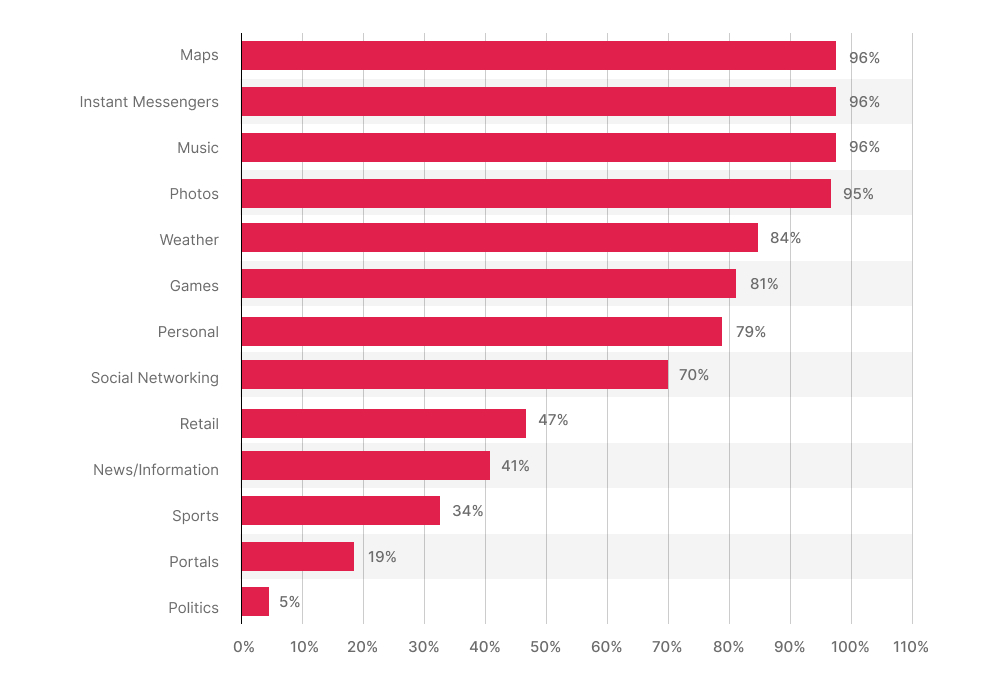
There are a plethora of devices from which digital content can be consumed. However, specific app categories experience a high prevalence of smartphone app usage. Smartphones accounted for 96% of digital map usage in the US and were used to consume 86% of all digital weather content.
Smartphone apps account for a significant 47% of retail consumption. People also use phones to access news and information. Despite the availability of numerous other platforms, our smartphone usage remains high at just over 40%.
Comparing App Usage: Smartphones vs. Tablets:
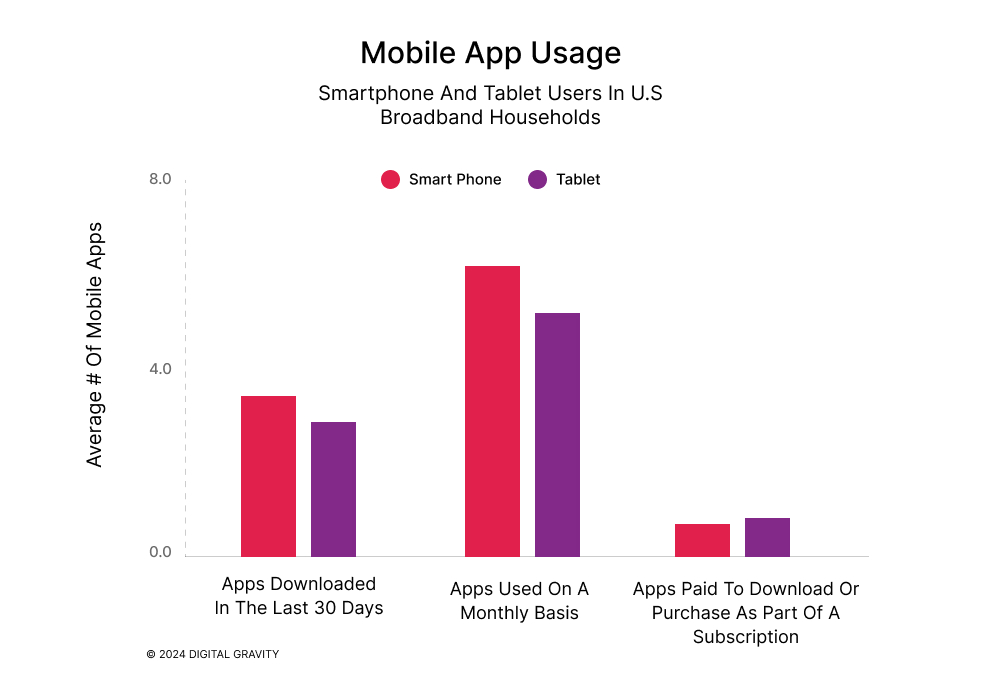
The average app usage growth rate is increasing day by day but it is not the same for all kinds of users. The cell phone usage statistics remain high but tablet usage is also taking precedence nowadays. On tablets, games, and social networking apps swap places as the most popular mobile apps.
While video-based apps see increased usage. Tablet use has less of a social aspect compared to smartphones. Users engage more with video content and news/books. Integration of new features could potentially impact tablet usage patterns. But smartphones have more app usage for messaging apps and social networking.
Mobile App Usage by Country
User behaviors tend to vary depending on their geographical location, and this principle similarly applies to mobile app usage. By examining the phone usage statistics for mobile apps in diverse regions, we can gain insight into our target audience and identify potential prospects for expansion.
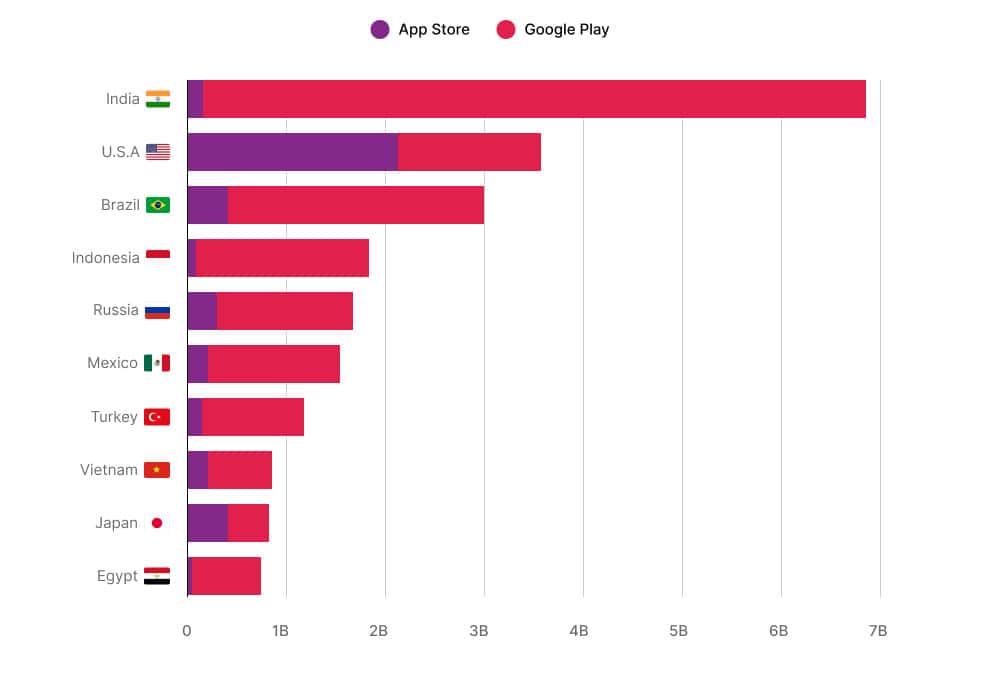
Mobile App Downloads by Country
The differing use of mobile app download statistics greatly impacts global marketing strategies. The regional discrepancies in mobile app usage are essential for devising effective global marketing plans.
Monthly Mobile App Usage & Engagement (in hours):
Following are the mobile app usage analytics and app usage statistics per Day Across Countries (2022):
- In 2022, Indonesian mobile app users spent an average of 5.39 hours on their devices daily, marking a 4% rise from the previous year.
- In 2022, Brazilian users spent an average of 5.19 hours per day using mobile apps and ranked second in terms of mobile app usage time.
- Users in Germany and China spent the least amount of time using mobile apps, with an average daily usage of 3.36 hours and 3.33 hours respectively, ranking them at the bottom of the list.
- In 2022, users in Singapore spent about 15% more time using mobile apps compared to the previous year.
- While mobile app users in China spent an average of 3.33 hours per day on their devices in 2022 which is an increase of 12% compared to the previous year.
Comparative Analysis of iOS vs. Android App Downloads Globally
Around 27 billion mobile apps were downloaded by users from Google Play in the initial quarter of 2023, while the mobile app download count stood at nearly 8.1 billion in the Apple App Store.
However, Google Play indeed dominates when it comes to the overall volume of downloads, revenue generation remains a stronger suit for the Apple App Store platform because of higher iPhone usage statistics.
An approximate total of 35 billion global app downloads were recorded in Q1 of 2023 from both the Apple App Store and Google Play.
Android dominates in market share while the Apple App Store remains a strong contender when it comes to generating revenue. Both platforms are constantly improving by introducing new features and capabilities that enhance user satisfaction.
Final Thoughts:
Finally, we hope you have learned how many apps are downloaded a day and used frequently. If you intend to create a mobile app, you can observe from the detailed analysis of the iPhone usage report and app download statistics in the Android market that the mobile app industry has become an integral part of our everyday routine and is poised for continued growth in 2024.
Despite reaching an all-time high in mobile usage statistics with several apps to download and positive disruption, we are sure the app market will see a positive upward trend for every data point.
Lastly, if you are looking forward to creating or building a new app in 2024. Check out Digital Gravity, the best mobile app development company that offers immaculate app development services for building customized and personalized apps that cater to your user persona.

